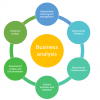
Business Analyst

Software Requirements Analysis with Example
Software requirement is a functional or non-functional need to be implemented in the system....
The decision making tools help you to map out all the possible alternatives to your decision, it's cost, as well as chances of success or failure. These applications provide a useful way to make the right choice by simplifying the decision making process and by drawing a diagram.
Following is a handpicked list of Top Decision Tools, with their popular features and website links. The list contains both open source(free) and commercial(paid) software.
SWOT stands for Strengths, Weaknesses, Opportunities, and Threats. SWOT Diagram is an important management application that helps any organization to assess its current situation. It works as a basic guide for strategic planning.
Tool to create SWOT Diagram: Creately

Creately is an easy way to create SWOT diagrams online. This tool contains 100s of readymade SWOT analysis templates. It has a user-friendly interface that enables you to customize your diagrams. You can use this tool to collaborate around your organization strategies in real-time.
Link: https://creately.com/lp/swot-analysis-tool-online/
Decision making diagrams are graphs that enable you to map out the decision you have taken. It helps you to estimate eventual actions based on the outcomes and risks. You can use this diagram for planning team strategy.
Tool to create Decision Making Diagram: Lucidchart

Lucidchart is a tool that helps you to build decision tree diagrams. This software can be used to collaborate with your teammates in realtime. It enables you to visualize potential paths and examine outcomes. Lucidchart can simplify decision making process using technical diagrams.
Link: https://www.lucidchart.com/pages/examples/decision-tree-maker
A decision matrix is a technique that contains values that helps you to identify and analyze the performance of the system. The elements of a decision matrix show results depend on specific criteria.
Tool to create Decision Matrix: Mindtools

Mindtools convert your data into row and column. It represents table row as your decision and factor as a column. This tool enables you to score each option from 0 (indicate poor) to 5 (indicate very good).
Link:
https://www.mindtools.com/pages/article/newTED_03.htm
Pareto Analysis is a method for decision-making. It is also known as 80/20 rule meaning, 20% of your activities will account for 80% of your results. It is used for prioritizing possible changes by identifying the problems and resolve them.
Tool to create Pareto Analysis: Visual Paradigm

Visual Paradigm helps you to add or input data to your pareto chart easily. It enables you to change chart's fonts and colors without any hassle. This tool automatically generates a chart based on the data available in the Google Sheet. Visual Paradigm allows you to resize the chart to any dimension.
Link: https://online.visual-paradigm.com/diagrams/features/chart-maker/pareto-chart-maker/
Cause and Effect or Ishikawa Diagram shows the causes of a particular event. It can be used for product design and to check its quality to identify possible factors causing an overall effect. You can group causes into categories to find sources of variation.
Tool to create Cause and Effect or Ishikawa Diagram: SmartDraw

SmartDraw is a simple tool that enables you to draw Ishikawa diagrams online or on your desktop PC. It provides support for Mac and Windows operating systems. Causes and effect diagrams are integrated automatically, and you can move or delete them quickly. SmartDraw offers numerous templates to draw Ishikawa diagrams.
Link: https://www.smartdraw.com/cause-and-effect/fishbone-diagram-maker.htm
Force Field Analysis enables you to examine your project. It provides a framework for looking at the factors that influence a particular situation. This analysis helps you to understand the process of any organization in a better way.
Tool to create Force Field Analysis: SmartDraw

SmartDraw is a decision making tool that provides templates to perform force field analysis. You can use this graphical tool for making decision. This drawing tool automatically adjusts items on the drawing area. This app also helps you to import or export a force field analysis diagram from Visio.
Link: https://www.smartdraw.com/force-field-analysis/examples/model-1-force-field-analysis/
Strategy map is a diagram that can be used to document strategic business goals. This map is created during the planning process of business. It is used as a primary material to check-in and review meetings.
Tool to create Strategy: Cascade Strategy

Cascade Strategy is a decision making tool that provides a drag and drop interface to build strategy Map. This tool supports a wide range of frameworks. It allows you to export map to the PDF file format.
Link: https://www.executestrategy.net/
A break-even analysis helps you to determine at what stage a new business product will be profitable. It's an economic calculation used to determine the number of products or services you need to sell to cover your costs.
Tool to create break-even analysis: Good Calculators
Good Calculators provides a calculator that enables you to calculate the break-even point. You can utilize this tool by just entering fixed and variable costs, selling price per unit, etc. It enables you to calculate it with just a single mouse click.
Link: https://goodcalculators.com/break-even-calculator/
Pugh Matrix is a diagram that is used to evaluate alternative solutions for business. It helps you to determine which solutions are more valuable than the others. This method does not require a massive amount of quantitative data.
Tool to create Pugh Matrix: Psychologia

Psychologia is a tool that provides a score for every option you have entered. This app enables you to find the highest score. It helps individuals to find the importance of specific criteria over others.
Link: https://psychologia.co/pugh-matrix/
Ratio analysis is a term used for comparison of items available in the financial statements of a business. It used to evaluate a number of problems with an entity, like its liquidity, efficiency of operation, and more.
Tool to create Ratio Analysis: Finstanon

Finstanon is a solution for financial analysis. It helps you to interpret profit ratio, liquid ratio, debt ratio, and more. This tool enables you to analyze more than 15 different types of metrices. Finstanon generates data in tables and diagrams.
Link: https://www.finstanon.com
Software requirement is a functional or non-functional need to be implemented in the system....
Task management is the process of managing a task through its life cycle. It helps in various...
Google Voice is a virtual telephone service that offers voicemail, call forwarding, text and voice...
Phone number apps are software that enables you to send messages, Wi-Fi, and cellular calling....
What is Business Analysis? Business Analysis can be understood as a research discipline that helps...
PowerPoint is a presentation software managed by Microsoft. This software helps you to creates a...