Linux

How to Download & Install Linux (Ubuntu) in Windows PC
Now that we know what Linux is, it is the time that to learn how we should install it on the...
The ELK Stack is a collection of three open-source products — Elasticsearch, Logstash, and Kibana. ELK stack provides centralized logging in order to identify problems with servers or applications. It allows you to search all the logs in a single place. It also helps to find issues in multiple servers by connecting logs during a specific time frame.
ElasticSearch, LogStash and Kibana are all developed, managed ,and maintained by the company named Elastic.
ELK Stack is designed to allow users to take data from any source, in any format, and to search, analyze, and visualize that data in real time.
In this ELK stack tutorial, you will learn
Now in this ELK stack tutorial, we will learn about ELK architecture:
Here is the simple architecture of ELK stack
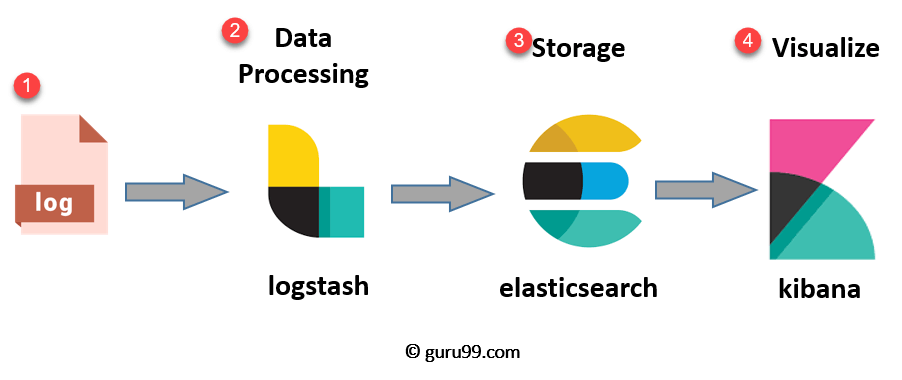
ELK Stack Architecture
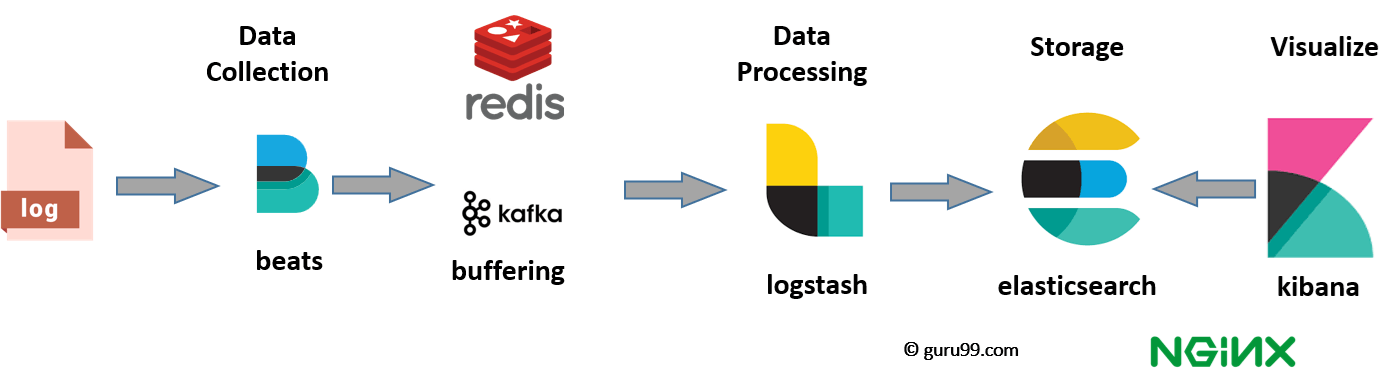
However, one more component is needed or Data collection called Beats. This led Elastic to rename ELK as the Elastic Stack.

While dealing with very large amounts of data, you may need Kafka, RabbitMQ for buffering and resilience. For security, nginx can be used.
Now in this Elastic stack tutorial, Let's deep dive all of these open source products:
Elasticsearch is a NoSQL database. It is based on Lucene search engine, and it is built with RESTful APIS. It offers simple deployment, maximum reliability, and easy management. It also offers advanced queries to perform detail analysis and stores all the data centrally. It is helpful for executing a quick search of the documents.
Elasticsearch also allows you to store, search and analyze big volume of data. It is mostly used as the underlying engine to powers applications that completed search requirements. It has been adopted in search engine platforms for modern web and mobile applications. Apart from a quick search, the tool also offers complex analytics and many advanced features.
Important Terms used in Elastic Search
Now in this ELK tutorial, let's learn about key terms used in ElasticSearch:
| Term | Usage |
|---|---|
| Cluster | A cluster is a collection of nodes which together holds data and provides joined indexing and search capabilities. |
| Node | A node is an elasticsearch Instance. It is created when an elasticsearch instance begins. |
| Index | An index is a collection of documents which has similar characteristics. e.g., customer data, product catalog. It is very useful while performing indexing, search, update, and delete operations. It allows you to define as many indexes in one single cluster. |
| Document | It is the basic unit of information which can be indexed. It is expressed in JSON (key: value) pair. '{"user": "nullcon"}'. Every single Document is associated with a type and a unique id. |
| Shard | Every index can be split into several shards to be able to distribute data. The shard is the atomic part of an index, which can be distributed over the cluster if you want to add more nodes. |
Logstash is the data collection pipeline tool. It collects data inputs and feeds into the Elasticsearch. It gathers all types of data from the different source and makes it available for further use.
Logstash can unify data from disparate sources and normalize the data into your desired destinations. It allows you to cleanse and democratize all your data for analytics and visualization of use cases.
It consists of three components:
format
Now in this LogStash tutorial, let's learn about features of LogStash:
Kibana is a data visualization which completes the ELK stack. This tool is used for visualizing the Elasticsearch documents and helps developers to have a quick insight into it. Kibana dashboard offers various interactive diagrams, geospatial data, and graphs to visualize complex quires.
It can be used for search, view, and interact with data stored in Elasticsearch directories. Kibana helps you to perform advanced data analysis and visualize your data in a variety of tables, charts, and maps.
In Kibana there are different methods for performing searches on your data.
Here are the most common search types:
| Search Type | Usage |
|---|---|
| Free text searches | It is used for searching a specific string |
| Field-level searches | It is used for searching for a string within a specific field |
| Logical statements | It is used to combine searches into a logical statement. |
| Proximity searches | It is used for searching terms within specific character proximity. |
Now in this Kibana tutorial, let's learn about important features of Kibana:
Features of Kinbana:
In cloud-based environment infrastructures, performance, and isolation is very important. The performance of virtual machines in the cloud may vary based on the specific loads, environments, and number of active users in the system. Therefore, reliability and node failure can become a significant issue.
Log management platform can monitor all above-given issues as well as process operating system logs, NGINX, IIS server log for web traffic analysis, application logs, and logs on AWS (Amazon web services).
Log management helps DevOps engineers, system admin to make better business decisions. Hence, log analysis via Elastic Stack or similar tools is important.
| Elk | Splunk |
|---|---|
| Elk is open source tool | Splunk is a commercial tool. |
| Elk stack does not offer Solaris Portability because of Kibana. | Splunk offers Solaris Portability. |
| Processing speed is strictly limited. | Offers accurate and speedy processes. |
| ELK is a technology stack created with the combination Elastic Search-Logstash-Kibana. | Splunk is a proprietary tool. It provides both on-premise and cloud solutions. |
| In ELK Searching, Analysis & Visualization will be only possible after the ELK stack is setup. | Splunk is a complete data management package at your disposal. |
| ELK tool does not support integration with other tools. | Splunk is a useful tool for setting up integrations with other tools. |
Netflix heavily relies on ELK stack. The company using ELK stack to monitor and analyze customer service operation's security log. It allows them to index, store, and search documents from more than fifteen clusters which comprise almost 800 nodes.
The famous social media marketing site LinkedIn uses ELK stack to monitor performance and security. The IT team integrated ELK with Kafka to support their load in real time. Their ELK operation includes more than 100 clusters across six different data centers.
Tripwire is a worldwide Security Information Event Management system. The company uses ELK to support information packet log analysis.
Medium is a famous blog-publishing platform. They use ELK stack to debug their production issues. The company also uses ELK to detect DynamoDB hotpots. Moreover, using this stack, the company can support 25 million unique readers as well as thousands of published posts each week.
Refer our ElasticSearch Interview Questions and Answers for fresher as well as experienced candidates.
Now that we know what Linux is, it is the time that to learn how we should install it on the...
Download PDF 1) What Is SDLC? SDLC is an abbreviation of Software Development Life Cycle. SDLC is...
What is Hadoop? Apache Hadoop is an open source software framework used to develop data processing...
Before learning HTML vs. HTML5, let's learn: What is a Markup Language? A markup language a system...
Computer Programming is a step-by-step process of designing and developing various computer...
Video grabbers are tools to store videos in numerous formats, including MP3 and MP4. These...