Tableau

Tableau Tutorial PDF for Beginners (FREE Download)
$20.20 $9.99 for today 4.6 (118 ratings) Key Highlights of Tableau Tutorial PDF 188+ pages eBook...
Data can be organized and simplified by using various techniques in Tableau. We will use the "Sample– Superstore.csv" text file for demonstration in this tutorial.
In this tutorial you will learn
The filters can be applied in a worksheet to restrict the number of records present in a dataset. Various types of filters are used in Tableau Desktop based on different purposes. The different types of filters used in Tableau are given below. The name of filter types are sorted based on the order of execution in Tableau.
Extract filters are used to filter the extracted data from data source. This filter is utilized only if the user extracts the data from data source.
Once the text file is connected to Tableau, you can see the live and extract option in the top right corner of data source tab. Live Connection directly connects to a data source. Extract connection extracts the data from data source and creates a local copy in Tableau repository. The procedure for creating an extracting filter is given as follows.
Step 1) After connecting the text file into Tableau,
This will create a local copy in Tableau repository.

Step 2) Next,

Step 3) "Add Filter" Window is open to select the filter conditions.
You can choose any of the fields and add as extract filter. In this example, we have selected'Category' as extract filter.

Once you click on OK button, it opens a filter window.

The filter window has multiple options to filter 'Category' based on various use case. All the use cases and its filter conditions are explained below.
Use Case 1: Select from List
By default, filter window opens the "Select from List" option. You can include or exclude the members present in the field using this option.
To include you can

To exclude the selected members,

There are two more option in the "Select from List".
All:
This option includes or excludes all members present in the field. In this example, all members are included by clicking on "All" option.
Step 1)

Step 2) Next,

To exclude all the members in the list, first, click on 'Exclude' button. Then select 'All' option and click on OK. This procedure adds the filter in extract data filter window.

None:
If you want clear all the selection made in the filter window and start a new selection, you can use this 'none'option. None option clears all the selection made in the filter window. Once it is cleared you can select the new members.

Use Case 2: Custom Value List
A custom value list allows the user to type the member name and filter the field accordingly. A custom value list can be created by following the given procedure.
Step 1) In the Filter Screen

There is an option in the window "Include all values when empty." It can be selected to include all values present in the field when the selected member has no data.

Clear List option clears the customs value list.

Use Case 3: Use all
This option selects all the members present in the field.

Use case 4: Wildcard
Wildcard option is used to filter the fields based on given wildcard match. Users can type the character and filter the field based on the match. The different types of matches are given as follows.
Contains | Select the members if the member name contains typed characters. |
Starts with | Select the members if the member name starts with typed characters. |
Ends with | Select the members if the member name ends with typed characters. |
Exactly matches | Select the members if the member name exactly matches with typed characters. |
Step 1)

Use Case 5: Filter on Condition
This option is used to filter the data set by giving several conditions. Filer condition based on field is given below.
By Field:

In the above example, the dataset is filtered to see the data where the sum of sales is greater than 1000.
The range of Values:
This option shows the minimum and maximum value of the selected field by clicking on 'Load' button. It can be used to refer the values.

You can write a formula to filter the dataset using this option. The procedure is explained below.
Steps:

In the above example, the written formula filters the data where sum of sales is greater than 1000.
Use Case 6: Top or bottom filters
This option is used to select top or bottom 'n' number of records.
By Field:
Step 1)

Step 2)

In the above example, the filter restricts the data set to show top 10 records based on the sum of sales.
By Formula:
The top or bottom condition can also be given through formula.
Steps:

In the above example, the formula was written to show top 10 records based on the sum of sales.
A data source filter is used to filter the data in data source level. It can restrict the records present in the data set. This filter is similar to extract filter on securing the data. But data source filter and extract filter is not linked to each other. Data source filter works on both live and extracts connection. The procedure to select data source filter is given as follows.
Step 1) Click on the 'Add' button placed on the top right corner of the data source tab.

Step 2) It opens the 'Edit Data Source Filters' Window. Click on 'Add' Option present in the window.

After clicking on 'add' button, follow the remaining steps from the topic 'Extract Filters' -> Step 3.
A Context filter is an independent filter that can create a separate dataset out of the original data set and compute the selections made in the worksheet. One or more categorical filter that separates the dataset into major parts can be used as a context filter. All other filters used in the worksheet works based on the selection of context filter. The functions of context filters can be explained through an excel sheet.

The figure shows a sample dataset. From the dataset, it is identified that 'Category' can be used as context filter as it can divide the dataset into major parts. Once the filter is applied to the dataset, the following data can be obtained.

When the category "Furniture" is selected, the data available in the particular category is shown in the figure. Other filters that can be applied in the sheet will be dependent on the category filter. This is the basic function of using context filter. Tableau creates a temporary dataset in repository engine based on the context filter selection. Once context filter is selected, all other selections and filters depend on the selection of specific context filter. The temporary table or data set that is created on selecting context filter loads whenever the context filter is changed.
Apply Context Filters in Worksheet:
Any dimension can be added as context filter by following the steps given below:
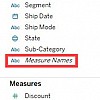
Step 1) The dimension to be added as context filter needs to be added in filter section box as given in the image.

Step 2) Right click on the dimension added in the filter section and select "Add to Context" option.

Step 3) Once the filter is selected as a context filter, the color of dimension box changes to grey color. This grey color box is an indication of context filter.

Removing Context Filter:
Any context filter can be changed back to normal filter by selecting the "Remove from Context" option which is available when right-clicking on the dimension. The color of dimension box will also change back to blue color as an indication.

Advantages of Using Context Filters:
Improve Performance:
When context filter is used in large data sources, it can improve the performance as it creates a temporary dataset part based on the context filter selection. The performance can be effectively improved through the selection of major categorical context filters.
Dependent Filter Conditions:
Context filters can be used to create dependent filter conditions based on the business requirement. When the data source size is large, context filter can be selected on the major category, and other relevant filters can be executed.
When a dimension is used to filter the data in a worksheet, it is called as Dimension filter. It is a non-aggregated filter where a dimension, group, sets and bin can be added. A dimension filter can be applied through the top or bottom conditions, wildcard match and formula.
The members present in a dimension can be included or excluded from the list using this filter. Dimension filter can be shown in a sheet or dashboard to change the filter condition dynamically. The process for adding a dimension as the filter is given as follows.
Step 1) Go to a worksheet as given in above topics and follow the steps.

The above procedure filters data set to show the records only for category 'Furniture.'

Measure Filter:
A measure filter can filter the data based on the values present in a measure. The aggregated measure values can be used in measure filter to modify the data. A measure filter can be applied in a worksheet by following the procedure.
Step 1) Go to a Worksheet

Step 2) It opens a window where you need to select the range of values. The other types of options present in the window are given as follows.
Range of values | Minimum and maximum range of measure value can be given and filtered. |
At least | A minimum value of a measure is given to filter the data. |
At most | A maximum value of a measure is given to filter the data. |
Special | An option to select null or non-null values and filter the data. |

The above example filters the data set based on the sum of sales value between 0 and 22638.
Custom or Quick Filter:
Filters can be customized based on the user selection. The filters can customize worksheets and dashboards to modify the data dynamically. The procedure to customize the filter is given as follows.
Step 1) Add the 'Category 'filter as shown in the topic Dimension filter.

Step 2) It shows the 'Category' filter box in the right side of the worksheet. By default, the filter shows the multi-value list as shown in the figure.

Step 3) You can select or unselect members present in the filter and modify the data.

User Filter:
User filter secure the row level data present in a dataset. It can be used when publishing the workbook on a server. Different filter conditions can be applied for different users. For example, assume there are three departments in a firm namely Furniture, Office Supplies, and Technology. By using the user filter, we can allow the users to show only the data relevant to their department. i.e., Users from 'Furniture' department can only see the data from category 'Furniture'. This can assure the security of row level data. The procedure to apply the user filter is given as follows.
Step 1)

Step 2)

Step 3)

Step 4) It opens a 'User Filter' window. Follow the below steps to add user filter.

It creates a user filter in Tableau. You can view the user filter under sets pane as shown below.

When the workbook is published in the server, only the filtered data is shown to the user. User filter can be created for multiple users to secure the data.
Summary:
$20.20 $9.99 for today 4.6 (118 ratings) Key Highlights of Tableau Tutorial PDF 188+ pages eBook...
What is Tableau? Tableau is a powerful and fastest growing data visualization tool used in the...
Tableau can create interactive visualizations customized for the target audience. In this...
Tableau is available in 2 versions Tableau Public (Free) Tableau Desktop (Commercial) Here is a detailed...
Tableau Server is designed in a way to connect many data tiers. It can connect clients from...
Tableau is a data visualization tool that can connect to almost any data source. However, its...