Blog

Intel i5 vs i7: Ultimate Showdown
What is Core in a Processor? A core is a unit frequently known as the Central Processing Unit...
Before we understand PowerBI, lets learn:
Business intelligence is a technology-driven method which helps you to analyze data and to provide actionable information which helps corporate executives, business managers, and other users to make informed business decisions.
In this Microsoft Power BI tutorial for beginners, you will learn Power BI basics like:
Power BI is a Business Intelligence and Data Visualization tool for converting data from various data sources into interactive dashboards and analysis reports. Power BI offers cloud-based services for interactive visualizations with a simple interface for end users to create their own reports and dashboards.
Different Power BI versions like Desktop, Service-based (SaaS), and mobile Power BI apps are used for different platforms. It provides multiple software connectors and services for business intelligence.
In this Power BI training, you will learn all the important concepts of Power BI and develop a foundational understanding of how to use Power BI tool.
Here are the most prominent use of Power BI tool:
Now in this Power BI desktop tutorial, we will learn about types of Power BI tools.
Some Important Power BI tools are:
Power BI desktop is the primary authoring and publishing tool for Power BI. Developers and power users use it to create brand new models and reports from scratch.
Costs: Free
Online Software as a Service (SaaS) where Powe Bl data models, reports, dashboards are hosted. Administration, sharing, collaboration happens in the cloud.
Pro license: $10/users/month
Power BI Data Gateway works as the bridge between the Power Bl Service and on-premise data sources like DirectQuery, Import, Live Query. It is Installed by Bl Admin.
It can host paginated reports, KPIs, mobile reports, & Power Bl Desktop reports. It is updated every 4 months and installed/managed by the IT team. The users can modify Power Bl reports other reports created by the development team.
Power BI mobile app is available for iOS, Android, Windows. It can be managed using Microsoft Intune. You can use this tool to view reports and dashboards on the Power Bl Service Report Server.
| Data source | Description |
| Excel (.xlsx, xlxm) | A workbook can have data entered manually or data, which is queried and loaded from external data sources. |
| Comma Separated Value (.csv) | Files are simple text files with rows of data. Every row can contain one or more values, which is separated by a comma. |
| Power BI Desktop (.pbi) | You can use Power BI Desktop to query and load data from external data sources. |
| Databases in the Cloud | It allows you to connect live to Azure SQL Database, Azure SQL Data Warehouse, etc. |
| Databases on-premises | You can connect directly to SQL Server Analysis Services Relational model databases. A Power BI Enterprise Gateway is required. |
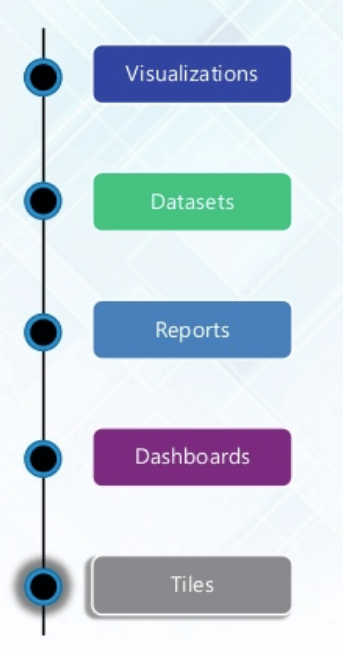
| Term | Description |
| Visualization | A visual display of information to achieve one or more objective. It offers a single-screen display of information. It alerts users on issues or problems Operational, Performance, Personal, etc. |
| Datasets | A dataset is something which you import or connect to. Datasets can be renamed, refreshed, removes, and explored. |
| Dashboard | The dashboard is a collection which contains zero or more tiles and widgets. It is used to represent a customized view of some subset of the underlying datasets. |
| Reports | A Power BI report is one or multiple pages of visualizations. It can be created from scratch, imported to a dashboard, and created using datasets. |
| Tile | It a single visualization found in a report or on a rectangular dashboard box which contains each visual. |
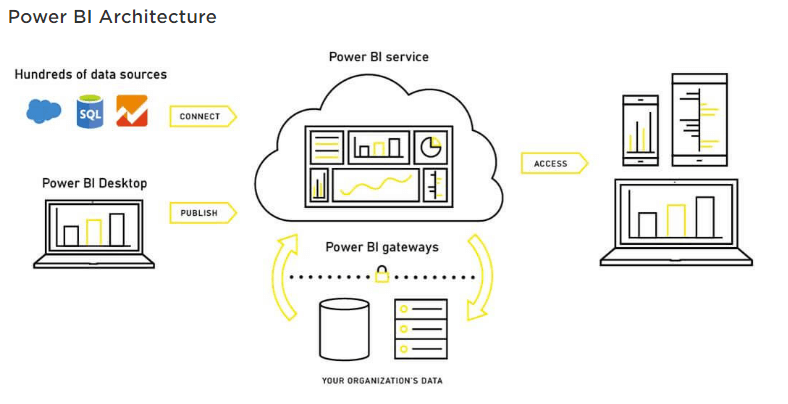
An organization needs to work with data which comes from different sources which can be in various file formats. The data should be extracted from a different source which can be from different servers or databases. This data is integrated into one standard format in a common staging area.
In this stage, the integrated data is still not prepared for visualization as the data needs processing. This data is pre-processed. For example, redundant values, missing values will be removed from the data set.
The business rule should be applied to the data when the data is cleaned. You can load that data back to Data Warehouse.
Once the data is loaded and processed, it can be visualized much better with use of various visualization that Power Bi has to offer. Use of dashboard and report helps one represent data more intuitively. This visual report helps business end users to take business decision based on the insights.
Step 1) Visit https://powerbi.microsoft.com/en-us/desktop/
And select Download free button
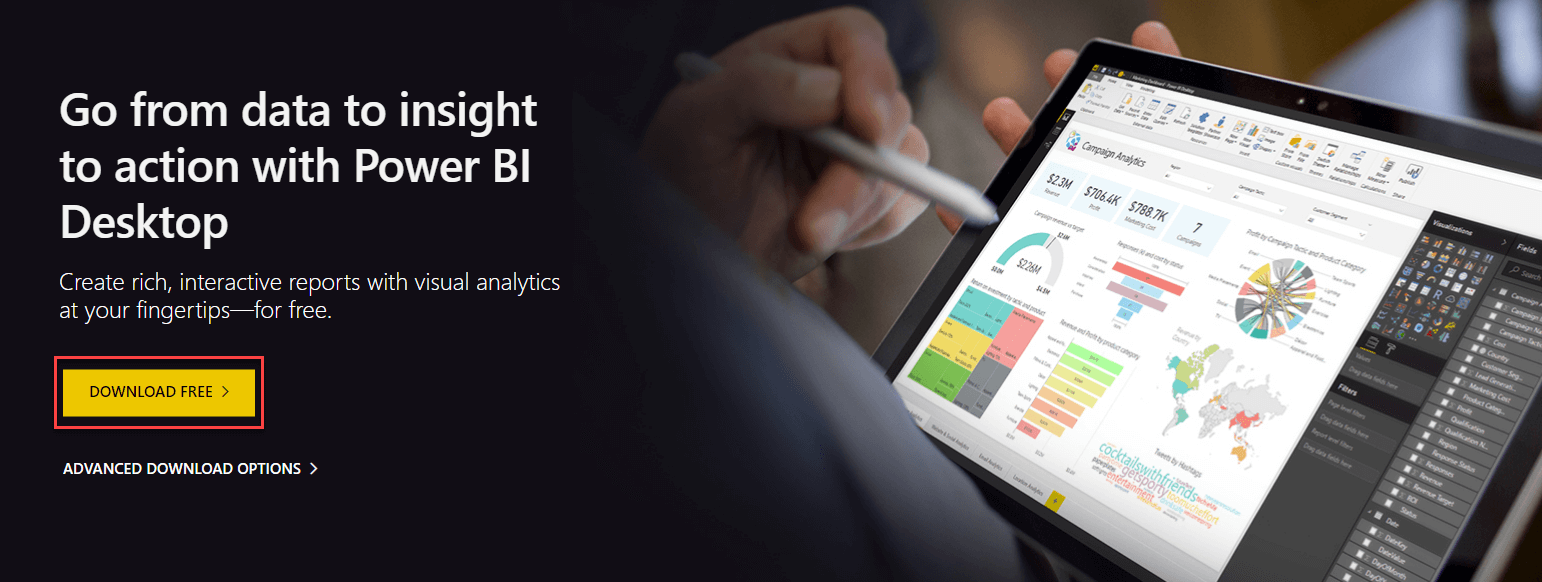
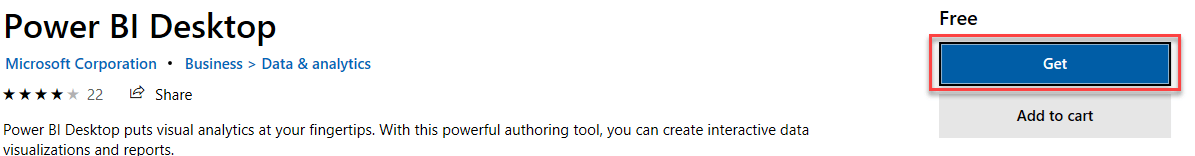
Step 2) You will be redirected to a Microsoft store and select Get button.
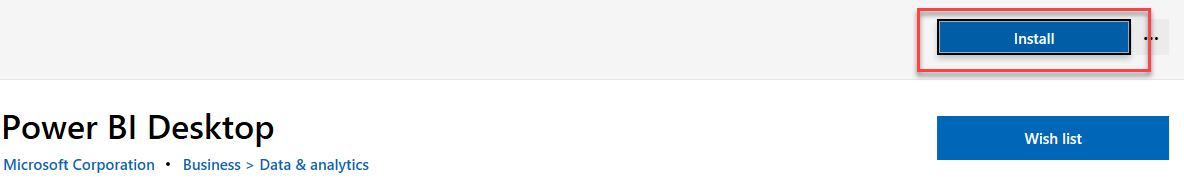
Step 3) Click on the Install button.
Step 4) You can see progress status on the screen.

Step 5) Before welcome screen you will ask to register to enter.
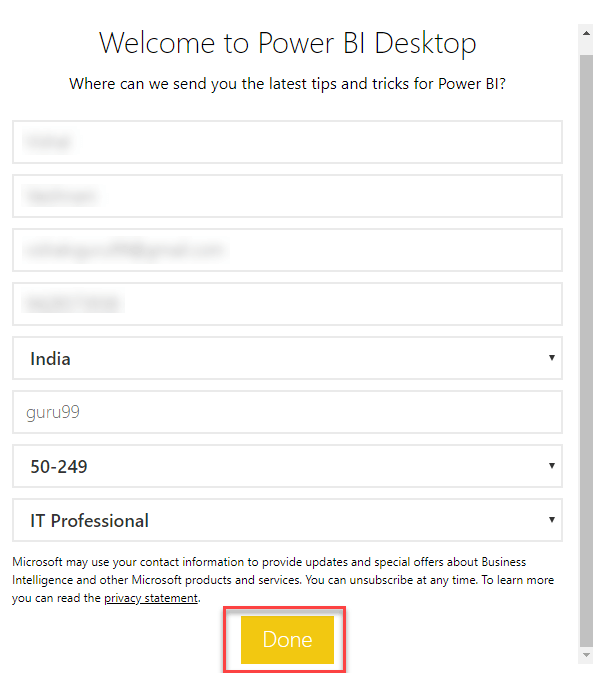
Step 6) When you run Power BI Desktop, a Welcome screen is displayed.
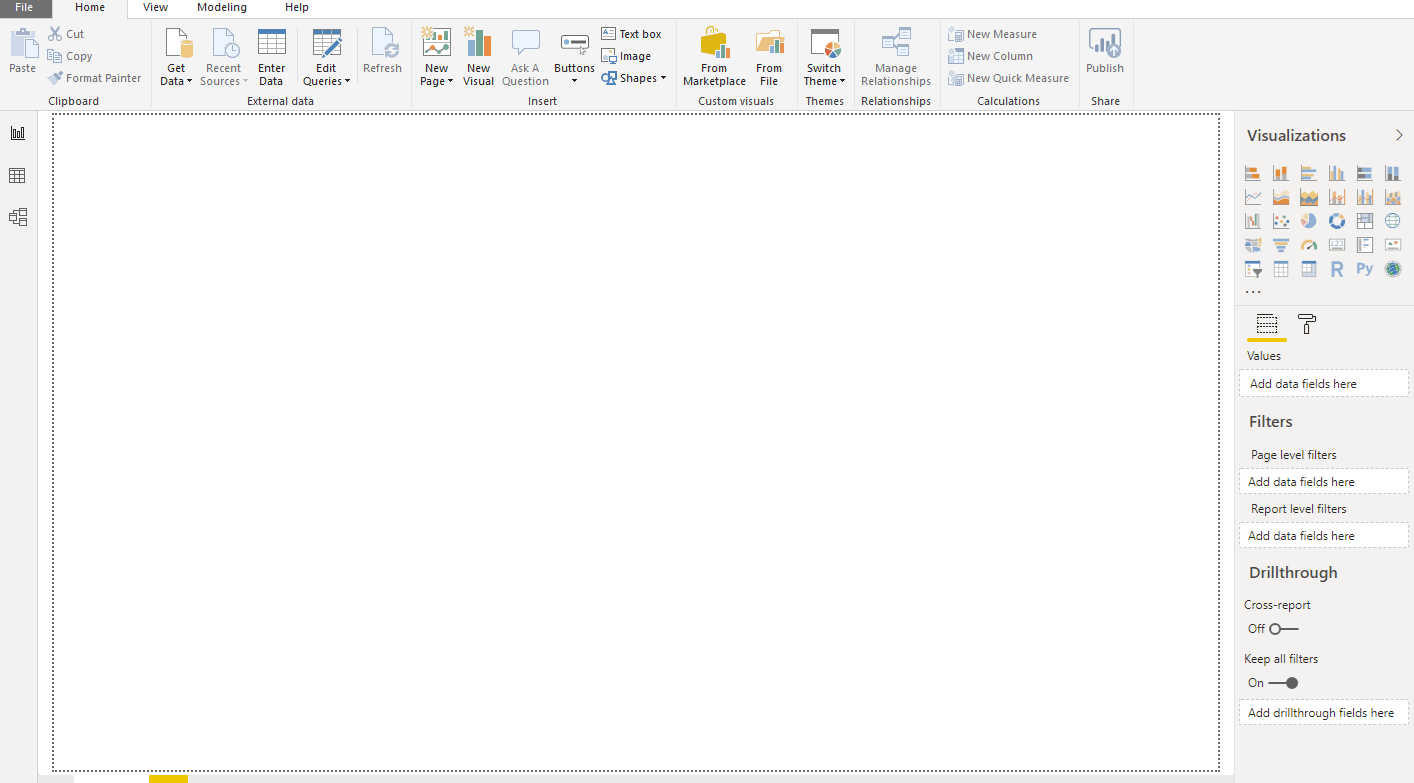
Below figure demonstrates the Power BI Dashboard:
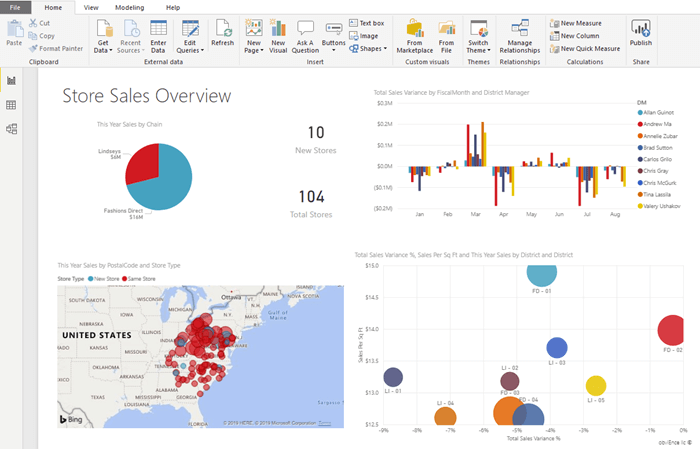
Power Bl Desktop is an enlargement tool used to generate dashboards and reports. Power Bl applications will be accessed by other users through desktop and mobile devices.
There are Power BI components are 5 main components released in the market.
DAX is a formula expression language which is called (DAX) which can be used with various visualization tools like Power BI. It is also known as a functional language, where the full code is kept inside a function. DAX programming formulas contain two data types: Numeric and Other.
Each is linked to the other by having common columns. Here is a simple diagram of Power BI Dashboard Example showing the relationships.
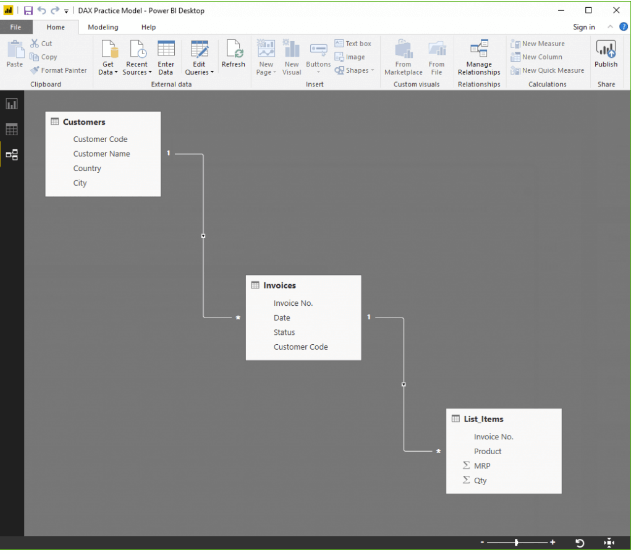
There are 3 things in Power BI where you can use
DAX –
Let's see all these Power BI examples and see how DAX functions works.
Calculated column allows you to create new columns based on the given data.
For example, there is no ' Final price' column available in the Items table. Here, the DAX function is used to calculate a new column when only total price & quantity are available.
Price = List_Items[MRP]*List_Items[Qty]
In the data shown in above Power BI example, each row will now have the respective calculated price.
You can perform a calculation using measure without the need to add any data as shown in the below Power BI example. This is very helpful for reports where the price can be displayed, without requiring an entirely new column to store it.
Example:
1] Total of the MRP column * Total of Qty column
DAX functions in tabular model return entire tables. For example, In order to generate a list of all the country the organization has clients in, use the function: cities touched = DISTINCT(Customers[City])
Filters hide rows that don't fit given criteria. A calculation after filtering out data will be applicable only on a row which matches those criteria.
Some Important DAX functions are:
This DAX function allows you to find the average from a given set of values as shown in the below Power BI example.
Example - AvgComm = AVERAGE(List_Items[Price])
Helps you to find the maximum from a given set of values.
Example – Find out the highest order. HighSale = MAX(List_Items[Price])
Helps you to find the minimum set of values.
Example – Allows you to find out the lowest order. LowestSale = MIN(List_Items[Price])
Count any umerical data.
Example – Count number of ticket issued. TicketVolume = COUNT(Invoices[Ticket])
This function helps you to join values in calculated columns. You can use ConcatenateX if using in measures.
Example – Concatenate the Item names, and MRPs will give a unique code for all the price points at which each product is sold. ProMrp = CONCATENATE(List_Items[Item],List_Items[MRP])
The function allows you to calculate the sum from the start of the current Year to the specified date. It performs calculate base on a calendar year, not a financial year.
Example – Calculate Sales totals for the price column. CumiSales = TOTALYTD(SUM(List_Items[Price]),Invoices[Date])
Returns everything. Ignores filters.
Example – Used with the calculate function above.
Here, are major differences between Power BI vs. Tableau.
| Parameters | Power BI | Tableau |
| Year of establishment | 2013 | 2003 |
| Application | Complete Dashboards for analysis | Allow Ad Hoc Analysis |
| Use by | Technical or Non Technical users | Only use by Analysts |
| Support | Very limited | Full support |
| Scalability | Good | Excellent |
| Infrastructure | SaaS | Flexible |
Here, are an important professional who uses Power BI tool:
Here are the advantages of using Power BI:
Here, are Cons/drawbacks of using Power BI:
What is Core in a Processor? A core is a unit frequently known as the Central Processing Unit...
Matrix Function in R A matrix function in R is a 2-dimensional array that has m number of rows and...
IT Service Management, which is popularly known (ITSM) aims to align the delivery of information...
What is Apache? Apache is a remarkable piece of application software. It is the most widely used...
Video converter is used when you cannot open a video of a certain format. It is also used when you...
A GPU benchmark is a test that helps you to compare the speed, performance, and efficiency of the...