Tableau

Introduction to Tableau Desktop Software: Workspace & Navigation
Tableau Desktop Workspace In the start screen, go to File > New to open a Tableau Workspace The...
In Supervised learning, you train the machine using data which is well "labeled." It means some data is already tagged with the correct answer. It can be compared to learning which takes place in the presence of a supervisor or a teacher.
A supervised learning algorithm learns from labeled training data, helps you to predict outcomes for unforeseen data.
Successfully building, scaling, and deploying accurate supervised machine learning models takes time and technical expertise from a team of highly skilled data scientists. Moreover, Data scientist must rebuild models to make sure the insights given remains true until its data changes.
In this tutorial, you will learn:
For example, you want to train a machine to help you predict how long it will take you to drive home from your workplace. Here, you start by creating a set of labeled data. This data includes
All these details are your inputs. The output is the amount of time it took to drive back home on that specific day.

You instinctively know that if it's raining outside, then it will take you longer to drive home. But the machine needs data and statistics.
Let's see now how you can develop a supervised learning model of this example which help the user to determine the commute time. The first thing you requires to create is a training set. This training set will contain the total commute time and corresponding factors like weather, time, etc. Based on this training set, your machine might see there's a direct relationship between the amount of rain and time you will take to get home.
So, it ascertains that the more it rains, the longer you will be driving to get back to your home. It might also see the connection between the time you leave work and the time you'll be on the road.
The closer you're to 6 p.m. the longer it takes for you to get home. Your machine may find some of the relationships with your labeled data.

This is the start of your Data Model. It begins to impact how rain impacts the way people drive. It also starts to see that more people travel during a particular time of day.
Regression technique predicts a single output value using training data.
Example: You can use regression to predict the house price from training data. The input variables will be locality, size of a house, etc.
Strengths: Outputs always have a probabilistic interpretation, and the algorithm can be regularized to avoid overfitting.
Weaknesses: Logistic regression may underperform when there are multiple or non-linear decision boundaries. This method is not flexible, so it does not capture more complex relationships.
Logistic regression method used to estimate discrete values based on given a set of independent variables. It helps you to predicts the probability of occurrence of an event by fitting data to a logit function. Therefore, it is also known as logistic regression. As it predicts the probability, its output value lies between 0 and 1.
Here are a few types of Regression Algorithms
Classification means to group the output inside a class. If the algorithm tries to label input into two distinct classes, it is called binary classification. Selecting between more than two classes is referred to as multiclass classification.
Example: Determining whether or not someone will be a defaulter of the loan.
Strengths: Classification tree perform very well in practice
Weaknesses: Unconstrained, individual trees are prone to overfitting.
Here are a few types of Classification Algorithms
Naïve Bayesian model (NBN) is easy to build and very useful for large datasets. This method is composed of direct acyclic graphs with one parent and several children. It assumes independence among child nodes separated from their parent.
Decisions trees classify instance by sorting them based on the feature value. In this method, each mode is the feature of an instance. It should be classified, and every branch represents a value which the node can assume. It is a widely used technique for classification. In this method, classification is a tree which is known as a decision tree.
It helps you to estimate real values (cost of purchasing a car, number of calls, total monthly sales, etc.).
Support vector machine (SVM) is a type of learning algorithm developed in 1990. This method is based on results from statistical learning theory introduced by Vap Nik.
SVM machines are also closely connected to kernel functions which is a central concept for most of the learning tasks. The kernel framework and SVM are used in a variety of fields. It includes multimedia information retrieval, bioinformatics, and pattern recognition.
| Based On | Supervised machine learning technique | Unsupervised machine learning technique |
| Input Data | Algorithms are trained using labeled data. | Algorithms are used against data which is not labelled |
| Computational Complexity | Supervised learning is a simpler method. | Unsupervised learning is computationally complex |
| Accuracy | Highly accurate and trustworthy method. | Less accurate and trustworthy method. |
Here, are challenges faced in supervised machine learning:
Tableau Desktop Workspace In the start screen, go to File > New to open a Tableau Workspace The...
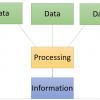
What is Data? Data is a raw and unorganized fact that required to be processed to make it...
$20.20 $9.99 for today 4.6 (118 ratings) Key Highlights of Tableau Tutorial PDF 188+ pages eBook...
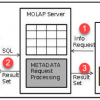
What is MOLAP? Multidimensional OLAP (MOLAP) is a classical OLAP that facilitates data analysis by...
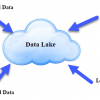
What is Data Lake? A Data Lake is a storage repository that can store large amount of structured,...
{loadposition top-ads-automation-testing-tools} A Data Warehouse is a collection of software tools...