Review

Best SSD (Solid State Drive) Laptop in 2021
Traditional storage systems are bulky and slow. If you are looking to purchase an SSD laptop, then I...
ACTIVITY DIAGRAM is basically a flowchart to represent the flow from one activity to another activity. The activity can be described as an operation of the system. The basic purpose of activity diagrams is to capture the dynamic behavior of the system.. It is also called object-oriented flowchart.
This UML diagram focuses on the execution and flow of the behavior of a system instead of implementation. Activity diagrams consist of activities that are made up of actions that apply to behavioral modeling technology.
In this, UML tutorial you will learn,
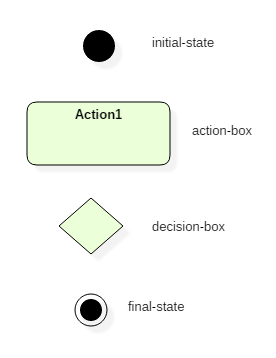
It is a behavior that is divided into one or more actions. Activities are a network of nodes connected by edges. There can be action nodes, control nodes, or object nodes. Action nodes represent some action. Control nodes represent the control flow of an activity. Object nodes are used to describe objects used inside an activity. Edges are used to show a path or a flow of execution. Activities start at an initial node and terminate at a final node.
An activity partition or a swimlane is a high-level grouping of a set of related actions. A single partition can refer to many things, such as classes, use cases, components, or interfaces.
If a partition cannot be shown clearly, then the name of a partition is written on top of the name of an activity.
Using a fork and join nodes, concurrent flows within an activity can be generated. A fork node has one incoming edge and numerous outgoing edges. It is similar to one too many decision parameters. When data arrives at an incoming edge, it is duplicated and split across numerous outgoing edges simultaneously. A single incoming flow is divided into multiple parallel flows.
A join node is opposite of a fork node as It has many incoming edges and a single outgoing edge. It performs logical AND operation on all the incoming edges. This helps you to synchronize the input flow across a single output edge.
Pins
An activity diagram that has a lot of flows gets very complicated and messy.
Pins are used to clearing up the things. It provides a way to manage the execution flow of activity by sorting all the flows and cleaning up messy thins. It is an object node that represents one input to or an output from an action.
Both input and output pins have precisely one edge.
Activity diagram in UML allows you to create an event as an activity which contains a collection of nodes joined by edges. An activity can be attached to any modeling element to model its behavior. Activity diagrams are used to model,
Activity diagrams are used to model processes and workflows. The essence of a useful activity diagram is focused on communicating a specific aspect of a system's dynamic behavior. Activity diagrams capture the dynamic elements of a system.
Activity diagram is similar to a flowchart that visualizes flow from one activity to another activity. Activity diagram is identical to the flowchart, but it is not a flowchart. The flow of activity can be controlled using various control elements in the UML flow diagram. In simple words, an activity diagram is used to activity diagrams that describe the flow of execution between multiple activities.
Activity diagrams symbols can be generated by using the following notations:
Activity diagram is a flowchart of activities. It represents the workflow between various system activities. Activity diagrams are similar to the flowcharts, but they are not flowcharts. Activity diagram is an advancement of a flowchart that contains some unique capabilities.
Activity diagrams include swimlanes, branching, parallel flow, control nodes, expansion nodes, and object nodes. Activity diagram also supports exception handling.
To draw an activity diagram, one must understand and explore the entire system. All the elements and entities that are going to be used inside the diagram must be known by the user. The central concept which is nothing but an activity must be clear to the user. After analyzing all activities, these activities should be explored to find various constraints that are applied to activities. If there is such a constraint, then it should be noted before developing an activity diagram.
All the activities, conditions, and associations must be known. Once all the necessary things are gathered, then an abstract or a prototype is generated, which is later converted into the actual diagram.
Following rules must be followed while developing an activity diagram,
Let us consider mail processing activity as a sample for Activity Diagram. Following diagram represents activity for processing e-mails. 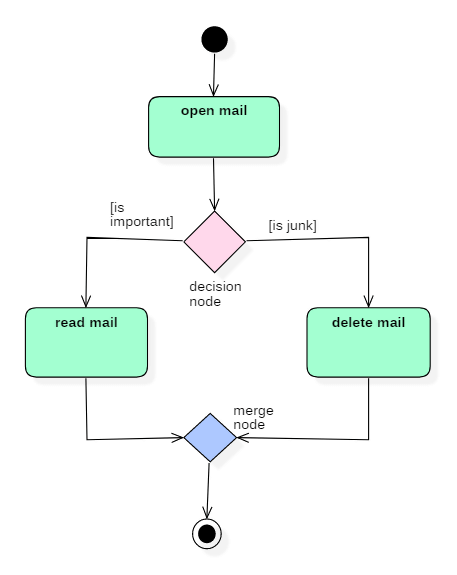
In the above activity diagram, three activities are specified. When the mail checking process begins user checks if mail is important or junk. Two guard conditions [is essential] and [is junk] decides the flow of execution of a process. After performing the activity, finally, the process is terminated at termination node.
Activity diagram is used to model business processes and workflows. These diagrams are used in software modeling as well as business modeling.
Most commonly activity diagrams are used to,
Traditional storage systems are bulky and slow. If you are looking to purchase an SSD laptop, then I...
What is Histogram? Histogram is a type of bar chart that is used to represent statistical...
What is XML? XML is a markup language which is designed to store data. It's popularly used or...
TeamViewer is a remote desktop software that allows you to connect to multiple workstations...
Who is a Software Developer? Software developers are professional who builds software which runs...
Ansible is a DevOps tool which automates software provisioning, configuration management, and...